
From Early Stage to Iconic and Everything In-between
By Joe Mathews, CEO and Founder of Franchise Performance Group (FPG)
Regardless of the service, product, investment level, or industry, all franchise brands seem to track along a common brand life cycle. Life cycles are growth curves with predictable stages which need to be successfully navigated to maximize the available opportunity.
Life cycles stages are linear, sequential, time-limited, and highly predictable if you know where to look.
The franchisors’ life cycle somewhat mirrors economist Raymond Vernon’s famed product life cycle. Vernon discovered that, while the opportunity timeframe and sales volumes aren’t consistent from product to product, the relative path is identical.
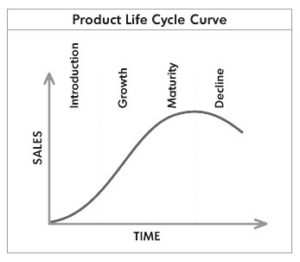
The key to managing a product life cycle becomes first knowing where the product is in the life cycle and then skillfully employing human and financial capital relative to that particular stage.
For instance, during the Introduction stage of Vernon’s product life cycle, a company needs to focus on marketing to build brand awareness, engage customer trial, grow a customer base and gather market share. During Growth, a company runs hard, seeking to establish a dominant position and maximizing the opportunity by outpacing the competition. During Maturity, sales soften, companies defend existing market share, protect existing customer relationships, and seek to extend profitability by keeping products relevant as long as possible. During decline, companies phase out or sell off the declining product lines, and then acquire or create new products and services and start a new product life cycle.
Notice how the shifting dynamics of each stage should dictate and determine the company’s strategy.
Rather than a smooth continuous curve like Vernon’s product life cycle, the Franchisor Life Cycle is a bit more complex. During each stage, franchisors face potential points of diminishing marginal returns, eventually leading to decline if they don’t skillfully implement the strategies relevant to that stage while at the same time planning for the next stage. The franchisors who successfully navigate all stages will ultimately capture a dominant leadership and be assigned a premium valuation which private equity rewards market leaders.
FPG asserts all successful franchisors are highly skilled in two areas: driving unit-level economics and building and sustaining a culture of trusting and workable franchisee relationships. As franchise brands move through each stage, unit-level economics should continually improve, financial predictability increase, and risk decrease. The franchisee relationships and corporate culture will evolve from an informal entrepreneurial culture to a more formal yet collaborative corporate culture which values relationships and performance in equal measure.
FPG Franchisor LifeCycleⓒ
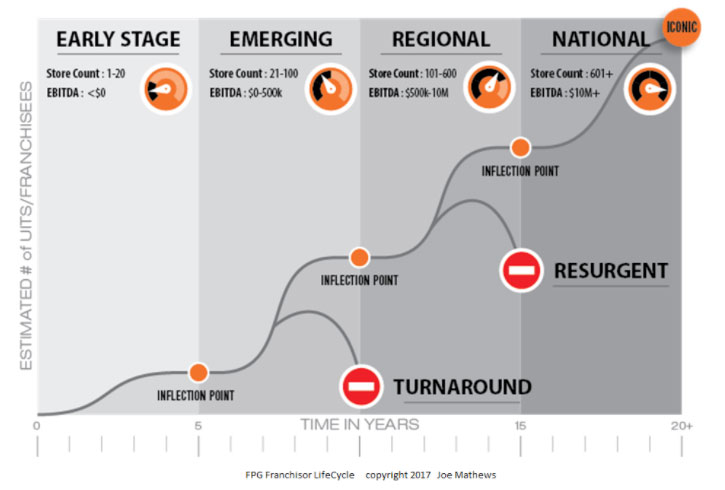
FPG asserts all 3,800 franchise brands can ultimately be bucketed into seven possible stages: Early Stage, Emerging, Regional, National, Iconic, Turnaround, and Resurgent. Keep in mind these stages reflect where a company is within the business of franchising, and doesn’t always reflect the lifecycle stage of the products and services they offer customers. Simply put, while the franchisor and product lifecycles may be related but these life cycles need to be considered separate and distinct.
Early Stage. These are essentially startup franchisors. While they may be highly mature local or regional brands, they have not proven themselves successful yet as a franchisor.
Emerging. Franchisors have proven themselves on a small scale. Their initial group of franchisees are succeeding and expanding. The franchisor starts to grow at a more accelerated rate.
Regional. Franchisors have proven themselves in multiple markets. Their target franchisee, by most statistical measures, would declare their businesses financially successful. More cautious, better capitalized, and growth-minded franchisees come into the chain at a faster pace, creating a system tipping point.
National. Franchisors have successful market penetration in most major media markets within the United States. Brands look to achieve critical mass in each major market.
Iconic. The brand, now dominant, disruptive, or game-changing, is deeply embedded in the American culture. Think McDonald’s, Subway, Dunkin’ Donuts. In many cases, these brands define their categories, set the customers’ expectations for competing brands, and determine the brand standards for all competitors.
Turnaround. Franchisors that do not successfully execute strategies relative to the stage they’re in, whose unit-level economics do not improve as the chain expands, and whose franchisee relationships become strained, will experience a slow-down in growth, flat sales and an eventual decline.
Because of the 1- to 2-year lag time between the franchisor’s strategic decisions and the impact of these decisions on the growth curve, many Turnaround brands don’t yet know they are Turnaround brands. Often franchisors mistakenly think they are Early Stage or Emerging Franchisors because the data hasn’t shown otherwise.
Resurgent. Franchisors who know they are in a Turnaround, correctly identify root causes, implement countermeasures, halt the decline, and start the slow reversal can become Resurgent brands. They often present themselves to the franchisees and customers as re-invented brands. Arby’s is an example of a successful Resurgent brand.
Inflection points
During any stage, franchisors may suffer from The Peter Principle. Consultant Laurence Peter coined this phrase in 1969 to describe a predictable organizational behavior pattern, which showed companies promote managers and employees until they fail, which Peter described as “rising to their level of incompetence.” Paradoxically, Peter found the main cause of failure in a manager or employees was their past successes. When placed in a new situation, managers and employees habitually implemented what worked in their last role, regardless of the appropriateness for their new situation. Rather than acknowledge and study the changing landscape and adapting accordingly, many people simply keep going with what they already think they know. Until they fail.
Inflection points represent the point in time where franchisors start to “peter out” and have to pivot, making decisions and applying resources which address the needs and issues they will encounter during the next stage. Too often, franchisors continue to make the same decisions that worked in their current stage and eventually fall off the growth curve and become the next Turnaround brand.
The key takeaway is that the franchisor’s mindset and tactics which worked so beautifully in the previous stage now become a barrier of entry to the next. If a franchisor doesn’t make a tactical shift, they will predictably peak and then decline. Because of the common 1- to 2-year lag between the time strategic decisions are made and the impact of these decisions on the curve, franchisors need to pivot before the data proves they are “petering.”
Just as each stage of Vernon’s product life cycle dictates strategy, each stage of FPG Franchisor Lifecycle dictates strategy. If the strategy is mismatched to the stage or if franchisors are slow to make new decisions, growth will peak and sales will flatten. If the brand continues along the same course, it eventually will slip into decline unless the franchisor takes corrective action.
The decision-impact lag time
Since franchisors cannot often experience or measure the impact of their decisions for one or two years, a franchisor risks wasting three of their most valuable resources: time, money, and human capital. Unfortunately, most franchisors are not fully aware that the impact of these decisions are accruing, and over time will surface as a series of significant breakdowns, often beyond the organization’s capacity to fix and recover.
For example, a high-flying Emerging franchisor may have doubled or tripled their recruiting results from the previous one or two years, outstripping the organization’s capacity to provide the same level of training, care, and support previous franchisees counted on. However, until the franchisees have been open more than a year and a problem is identified, the chain continues to aggressively recruit franchisees ensuring even greater organizational strain and weaker than anticipated franchisees’ results.
During that 1- to 2-year period of rapid franchise sales growth, the franchisor falsely assumes they are winning but has been planting landmines with each successive franchise agreement. Too often, franchisors expand more quickly than the organization’s capacity to diagnose and fix the problems, creating the next Turnaround brand.
3-year planning horizons
Because each stage is identifiable and predictable, and the stage dictates strategy, franchisors should always be planning for the next stage while implementing the appropriate tactics for the existing stage.
Franchisors who are not currently working from a 3-year planning horizon will often to pivot too late, at the bare minimum missing growth opportunities and slowing momentum, but often sending the chain into decline and Turnaround status.
For example, too often franchisors assign their failures onto the struggling franchisees by creating a cultural belief “These franchisees didn’t follow our system” instead of asking the more responsible question, “What was missing from our systems that the most recent group of franchisees struggled?” They falsely believe the next crop of new franchisees will be different, falsely assuming although “Fall Harvest” was a bust, they will make up the difference during “Spring Harvest,” as if one has no impact on the other. So, they wait. Then Spring Harvest is also disappointment. Over a year goes by, problems go unidentified, and the chain loses precious momentum.
Educated franchisors act differently. They don’t wait for system failures. They ask questions such as, “We have proven we can onboard 10 franchisees per year. Over the next two years, what will it take to successfully onboard 40?” Then they build the new system and organization.
The payout
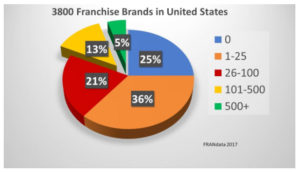
According to FRANdata’s 2017 research, out of approximately 3,800 franchise brands that exist, 82% fall into the Early Stage, Emerging, and Turnaround brands with less than 100 units or territories. Only 13% fall into the Regional Franchisor 100-500 units or territories, and 5% of brands are classified as National or Iconic. FPG models show it takes most franchisors 40 to 100 units to achieve royalty self-sufficiency, meaning the franchisor can sustain operations on recurring revenues alone rather than depending on one-time franchise fee cash influxes. Royalty self-sufficiency is a franchisor’s first major benchmark for financial stability. Therefore, approximately 82% (represented in red, blue, and orange) of all franchise brands lack financial stability and could be classified as at risk.
The market begins to offer a premium valuation on franchisors with 100 or more financially sound units. Some franchisors mistakenly think they should sell franchises as quickly as possible and then get out before operational problems surface. The market values franchisors by the predictability of future recurring revenue streams. Private equity (PE) can spot an unstable pump-and-dump, franchise-a-fast-as-you-can operation by examining sales volumes and predicting franchisees’ unit-level economics. If franchisees’ returns appear weak, PE will assume these royalty streams are at-risk and devalue the franchisor. The PE market wants franchisees on a sound financial footing who will predictably pay royalties for the duration of their agreement and renewal periods.
Refer to the chart below for a quick estimate as to what your chain is worth and what upside exists for franchisors who successfully navigate the learning curve of each life cycle.
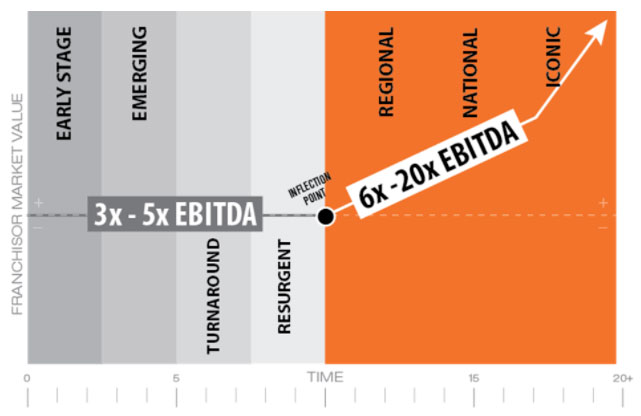
The big breakthrough
Notice how valuations spike at the Regional level, where EBITDA starts exceeding $1 million per year, largely driven by margins created by predictable recurring revenue streams.
Keep in mind, to achieve 6-20X payout, the market assumes the franchisees will be around at least that long to deliver an acceptable return for the acquirer.
At a recent franchise conference, a speaker presented data which showed less than 5% of franchisors get to 100+ units within 10 years. For instance, Subway had only 12 units on their 10th anniversary. They had about 400 units on their 20th anniversary. They were in business more than 15 years before hitting their tipping point. It took McDonald’s about 10 years to open its 100th location.
About Joe Mathews
Founder and CEO of Franchise Performance Group, Joe Mathews has more than 30 years of experience with such national chains as Subway, Blimpie, MotoPhoto and Entrepreneur’s Source. Mathews specializes in franchisor brand strategy and franchisee recruitment. He is a regular presenter at IFA conferences, and has served as an instructor with the ICFE (Institute of Certified Franchise Executives) and IFA Supplier Board. Mathews is author/co-author of four books on franchising, Street Smart Franchising with Don Debolt and Deb Percival, Franchise Sales Tipping Point, Developing Peak Performing Franchisees and How to Create a Franchise Sales Breakthrough. Guaranteed.
Special thanks to Don Welsh, President and Partner, Franchise Performance Group and FRANdata.
About FPG
Franchise Performance Group (FPG) is a franchising specialty management consulting firm offering brands strategic advisory services, relationships, and a full range of tactical services to help franchisors create a chain of 400 units or more. We possess the skilled executives, relationships, and intellectual property to help brands grow nationally and become iconic.
FPG executives have over 100 years of executive franchising experience and have worked with such breakthrough brands as Subway, Sonic, Sylvan Learning Centers, Marco’s Pizza, Arby’s, Great Clips, Sport Clips, BrightStar Care, and Menchie’s.